
Sustainable Food for a Sustainable Planet: Evaluating the Climate Impact of Different Food Categories
Sustainable Food for a Sustainable Planet: Evaluating the Climate Impact of Different Food Categories
Striped Insights
Abstract
This article by Riccardo Gismondi (data scientist) and Hannes Leo (economist)
examines the various negative side-effects of our current food system on the earth’s biosphere, such as huge greenhouse gas (GHG) emissions, environmental pollution, biodiversity loss, and negative health impacts. It explores the evidence-based solution proposed by the EAT-Lancet diet, as well as the criticism that optimizing diets according to their environmental impact is too complicated. By using data from Life Cycle Assessment (LCA) studies, the article demonstrates that opting for plant-based products over animal-based products can lead to a significant reduction in CO2 emissions. Moreover, it highlights the importance of considering not only CO2 emissions, but also biodiversity loss, water consumption, use of fertilizers, and environmental pollution when evaluating the environmental impact of food.
The food system as the main driver of environmental change
There are many analyses that document the negative “side-effects” of our food system on the earth’s biosphere. The huge GHG emission (1/3 of human related GHG emissions), environmental pollution, biodiversity loss, water and land use as well as the negative health impact and the reduction of life expectancy are the major “side effects”.
The root of these problems on the human side is the overproduction and overconsumption of animal products in westerns style diets. Despite the obvious cause of the problem and evidence-based solutions like the EAT-Lancet diet (see Lancet Commission, 2019), many claim that optimizing diets according to their environmental impact is too complicated and beset by measurement error and methodological problems of the life cycle assessment (LCA) studies produced for this purpose. LCA studies try to measure all inputs and impacts from cradle to grave of a product or produce and deliver - amongst other information – an estimate of GHG emissions for producing one kg of a specific product which is used to assess the climate impact.
Measurement error, varying system boundaries, individual decisions…
Given that the GHG emissions per kg of a specific food product are known, it is simply a matter of multiplying the amount used with the LCA-based emissions values. Critics argue that due to the complexity of production processes, methodological choices, system boundaries and the related decisions to be taken, measurement errors etc. the applicability of this method for day to day decisions (see Clune, 2017 for an overview) is far from being evident. And indeed, the values for the lowest and highest GHG gas emissions for the same product vary significantly, e.g. for beef emission estimates range from 10kg to 100kg. Consequently there is a factor of 10 between these products. For plants this spread is even larger and ranges from almost zero to close to 7 kg - a factor of 57.
Median, quartiles... – so what?
Practitioners found simple ways to deal with such huge differences. Assume that all LCA study estimates for a specific product are ranked according to the size of the estimated GHG emissions. Then divide the number of studies into four segments that hold an equal number of studies. The first segment - better quartile - holds the studies with the lowest emissions, followed by the quartile that hold studies with the second lowest emission values - the second quartile - etc. until the 4th quartile that contains the 25% of studies with the highest emissions. The emissions of the study right in the middle of this ordered sample is called the median value for this product. It is different from the average and often a better approximation for all of the values measured by the studies analysed.
Plants vs. Animals: 5:1
Figure 1a and 1b show the emissions values of the ranked studies for plant-based and animal-based fresh foods. The value in the middle - the median is highlighted as an approximation of CO2 emissions for each category. For animal products, these CO2eq emissions are around 4kg per kilo of product, for plant products around 0.5kg. Ruminants are the food category that come with the highest median CO2 emissions - 26,9 kg CO2eq emissions - followed by non-ruminants (5,7 kg), fish (3.8 kg), poultry (2.7kg) and dairy (1,4 kg). Plants are in a league of their own displaying median emissions of only 0.5kg CO2eq (see table 1).
By getting rid of the highest emission values - that are all in the 4th quartile - and taking emission values for the first and the third quartile one gets a good estimate for the most likely CO2eq. emissions of each food category. For dairy this may be somewhere between 1.2 and 1.8 kg of CO2eq., for ruminants this is between 22kg and 33kg. The estimates in the 3rd quartile are still 2 to 3 times higher than in the first quartile. This difference is still large but much smaller than in the initial observation of magnitude 10 for ruminants and 57 for plants.
Figure 1a: Distribution of CO2eq emissions per kilogram of plants
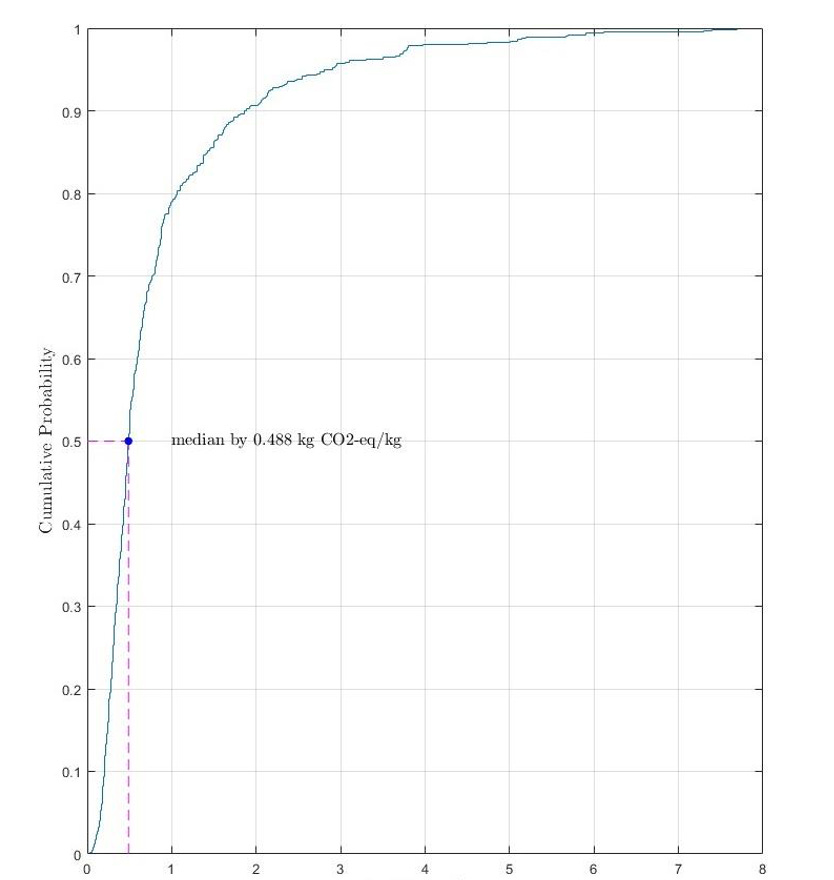
Figure 1b: Distribution of CO2eq emissions per kilogram animal-based products
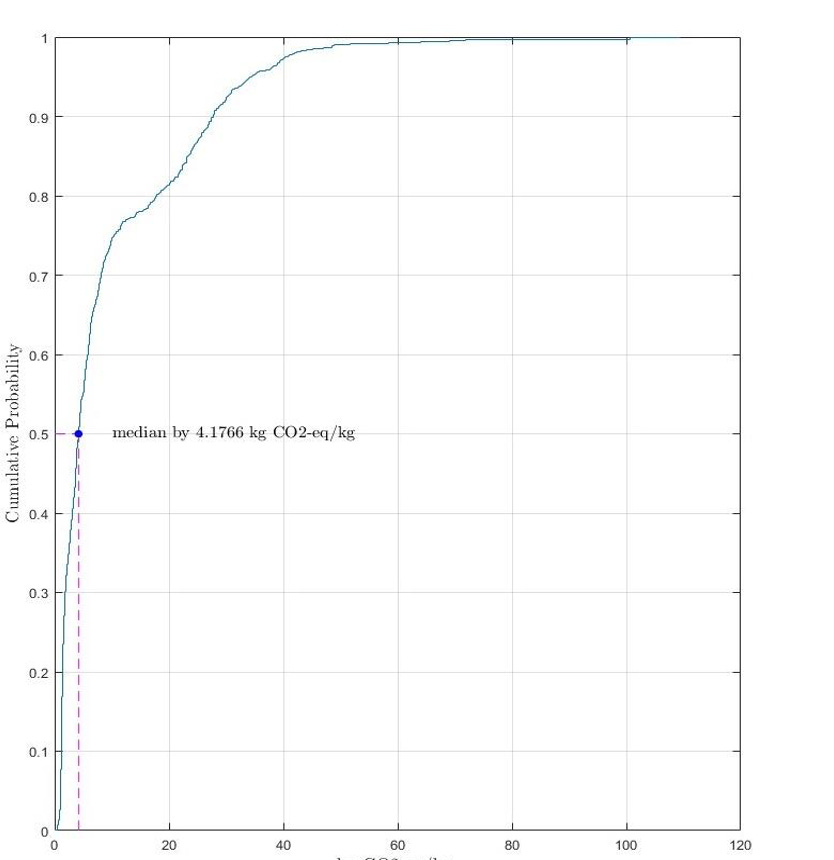
Source: Own calculations based on data from Clune et al. (2017).
The remarkable insight that can be taken from Table 1 is that the higher emission estimate for plant-based products (third quartile: 0.9 kg CO2eq.) is lower than the lower estimates - first quartile - for all animal-based product categories. This means that opting for plant-based products will, on average, lead to a significant reduction inCO2 emissions. The emission reduction factor in the far right column of Table 1 displays how much you can reduce CO2 emissions by substituting animal-based products with plant-based alternatives. For example, replacing ruminant meat with a plant-based product would reduce CO2 emissions to one-thirty-seventh of the animal product - assuming the substituted plant product has the same weight.
Table 1: CO2 emission for different subsets of the surveyed LCA studies
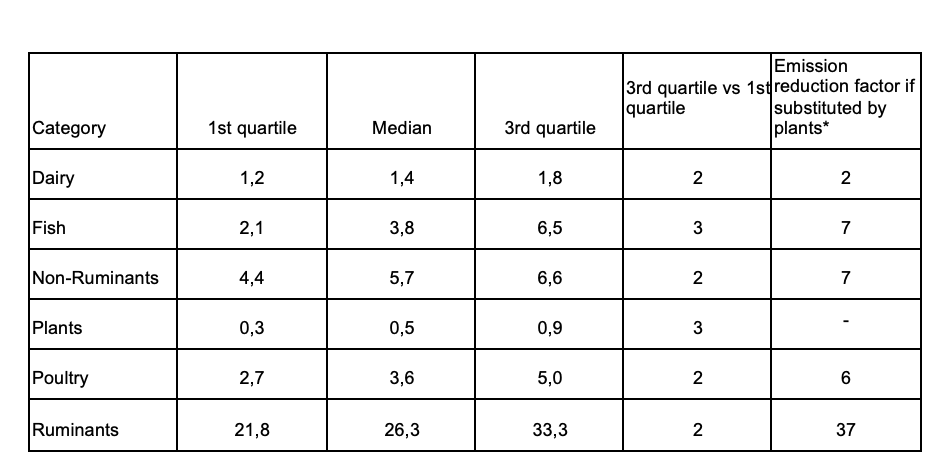
* Emission Reduction Factor (ERF)= Emissions of 3rd quartile of category x divided by emissions of 3rd quartile of plants , rounded.
An ERF of 2 means the emissions could be halved by substitution this food category byplants.
Source: Own calculations based on data from Clune et al. (2017).
The avocado conundrum
The environmental impact assessment is complex, as it requires consideration of not only CO2 emissions, but also factors such as biodiversity loss, water consumption, use of fertilizers, environmental pollution, and health impacts. Avocados are a good example for this statement. The production of one kilogram of avocados in Peru that are consumed in Germany generates slightly more than one kilogram of CO2 (Figure 2; more estimates can be found on the LiveLCA.com page). If eating nothing but 2.43kg of avocados per day keeps you happy, you would just about exhaust your daily food related CO2 budget. Formulated differently, your consumption pattern would keep you within the limits of international climate agreements even if you feed solely on the much “maligned” avocados. Still you would like to double check if they are produced in an environmentally friendly way.
Figure 2: Spotlight on avocados

Source: https://livelca.com/products/avocados_a4baf62f-86f6-422e-8136-53eee0a08203
While avocados are far better than their reputation, animal products are not: Based on the average CO2 emissions of 14.24 kg per kg of meat (see livelca.com), staying within stated climate targets would demand that you eat no more than 0.19 kg meat per day with no side-dishes. You would then consume about 70 kg of meat per year, which is not far from the actual average consumption in Europe. This causes food-based CO2 emission of slightly less than a tonne per year. While this meat-only diet would keep your CO2 emissions at a justifiable level, the overall impact on your health would be devastating. To avoid this outcome, the experts of the Lancet Commission (2019) developed dietary recommendations that respect the boundaries of the planet and the need to provide healthy food for the still growing world population. In terms of meat intake, this diet recommends a steep reduction to about 15 kg per year.
The estimates for fresh products used here are not very helpful when deciding within a category, as the real emissions are different for each producer and usually no up-to-date – and in most cases, not even a historic – estimate is available. LCA studies and the above calculations help to decide between categories, e.g. between ruminants, non-ruminants or poultry, and point clearly to the most climate-friendly alternative: plants. Therefore, the most obvious recommendation from a climate point of view is to significantly increase the plant-based share of foods in your diet. This would also be the optimal choice from a health and animal welfare perspective.
Literature
The Lancet Commission, Food in the Anthropocene: the EAT–Lancet Commission onhealthy diets from sustainable food systems, 2019,https://www.thelancet.com/action/showPdf?pii=S0140-6736%2818%2931788-4
Clune, S., Crossin, E., Verghese, K., Systematic review of greenhouse gas emissions fordifferent fresh food categories, Journal of Greener Production, 140, 2017,http://dx.doi.org/10.1016/j.jclepro.2016.04.082